Your Financial Intelligence Hub Help Centre
Back to Learning Centre

Your Financial Intelligence Hub

Understand your numbers, compare performance and turn financial information into better business decisions.
Follow the learning path below to enter your data securely, review your results and identify the areas requiring attention.

Financial intelligence illustration

Input

Enter the financial and operational information needed.

Understand

Turn the inputs into clear financial performance metrics.

Benchmark

Compare ratios against relevant performance benchmarks.

Improve

Focus attention on the ratios with the greatest impact.

Learn Your Way Around

Explore the six sections below to understand how your inputs become meaningful financial insight.

1

Input Calculator

Enter the information required to calculate your financial and operational metrics.
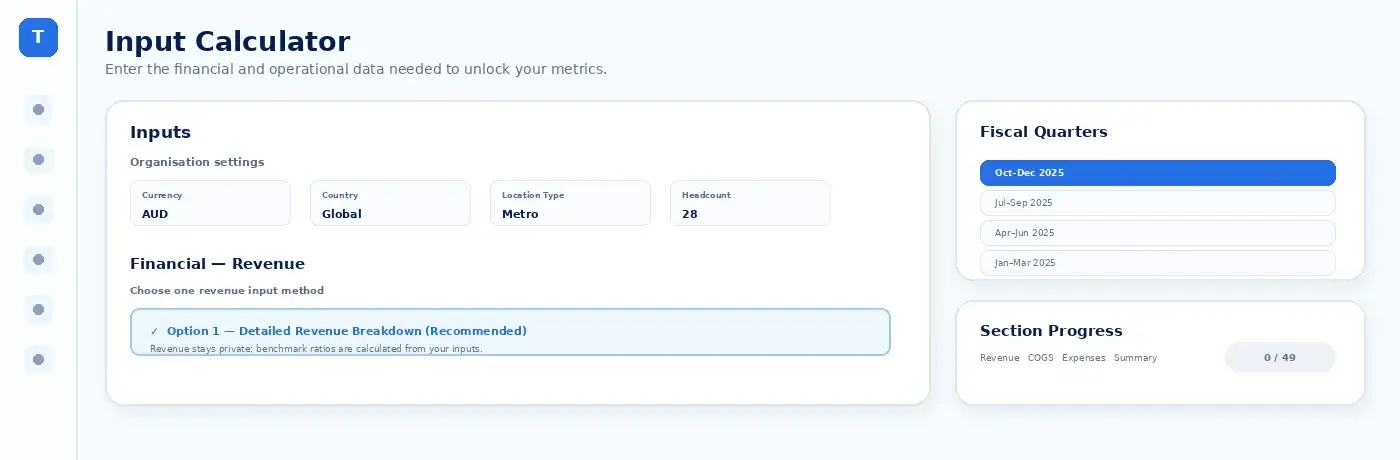
Input Calculator dashboard preview
Confirm currency, country, location type and headcount
Choose the active fiscal quarter
Complete Revenue, COGS, Expenses and Summary inputs
2

Executive Summary

See the most important financial results, business-health indicators and priority areas in one view.
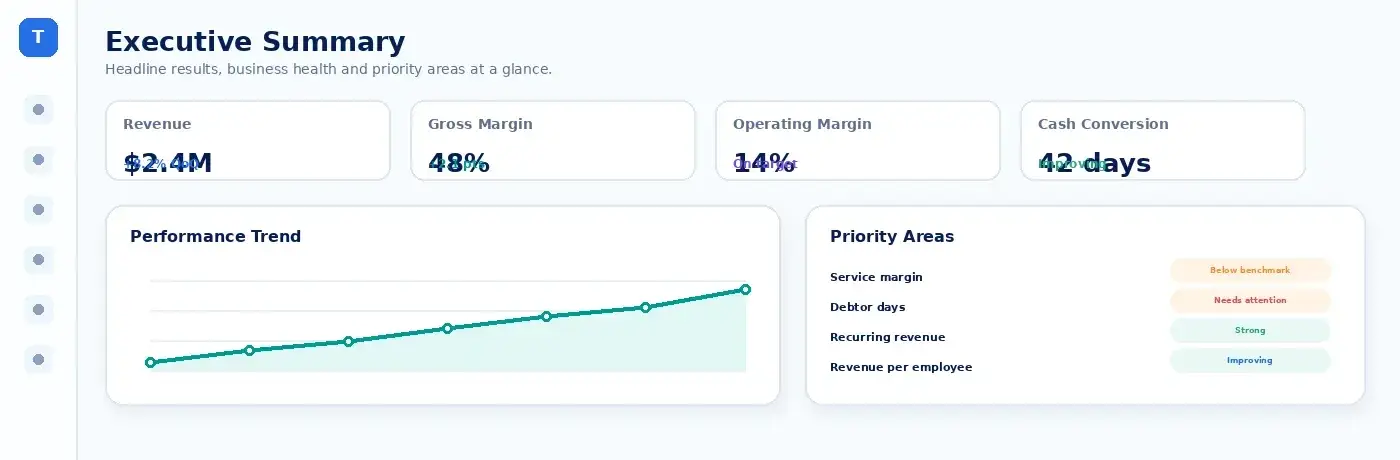
Executive Summary dashboard preview
Review headline performance indicators
See strengths, risks and priority issues
Compare current results with available benchmarks
3

Revenue & GM

Understand revenue composition, recurring income, cost of goods sold and gross-margin performance.
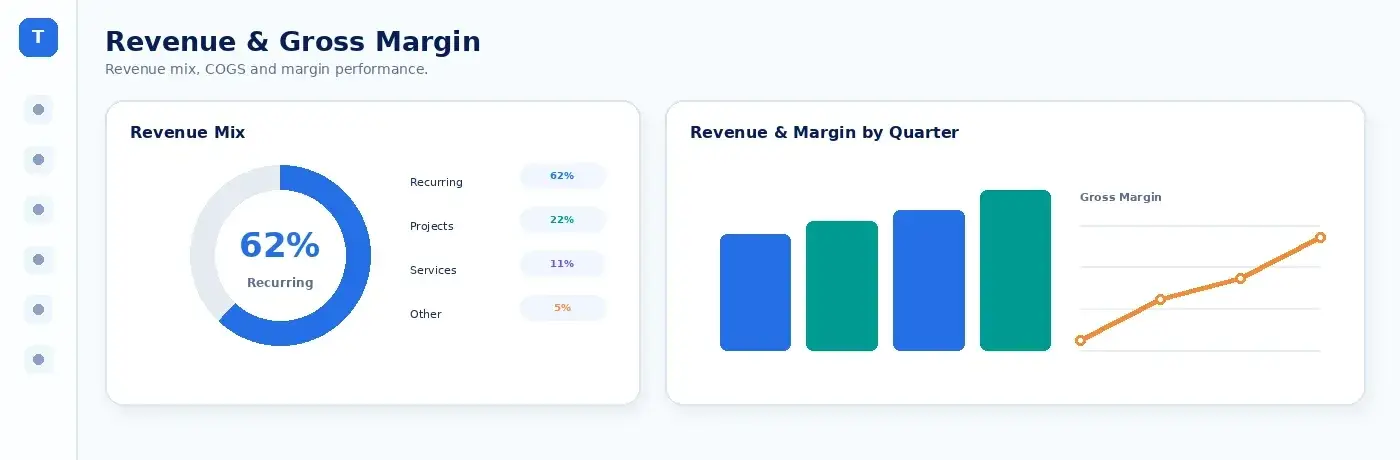
Revenue & Gross Margin dashboard preview
Review total revenue and revenue mix
Compare recurring and one-time income
Track gross margin and COGS performance
4

Opex & Productivity

Review operating expenses, workforce productivity and the efficiency of your cost base.
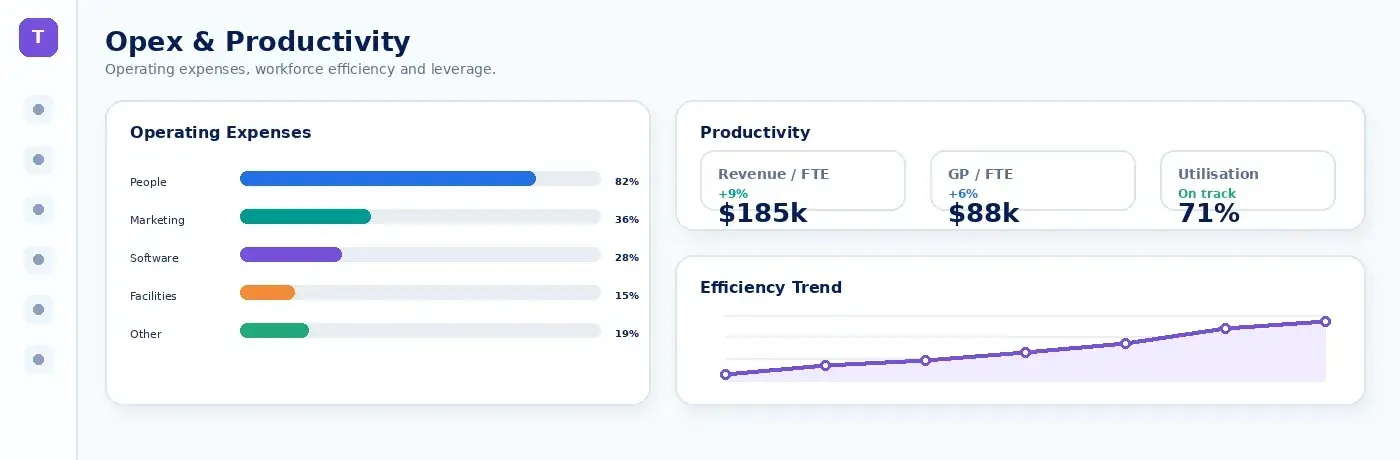
Opex & Productivity dashboard preview
Review major operating-expense categories
Compare revenue and gross profit per employee
Assess productivity and operating leverage
5

Operational Ratios

Use financial ratios to assess liquidity, efficiency, working capital and operational resilience.
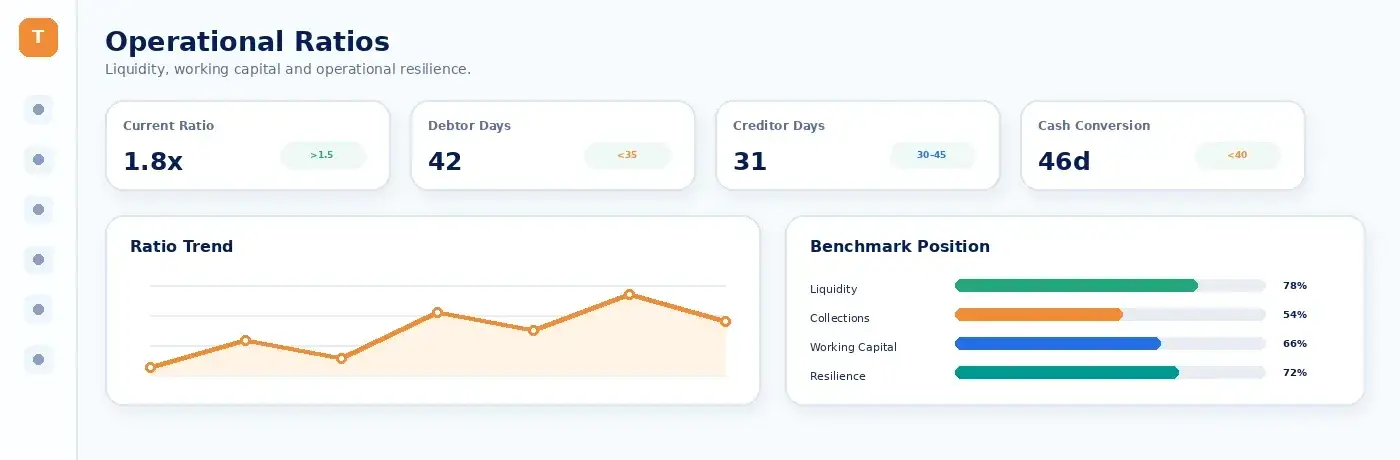
Operational Ratios dashboard preview
Review liquidity and cash-management indicators
Understand debtor, creditor and working-capital performance
Identify financial resilience and efficiency risks
6

Service Delivery

Understand how service delivery, utilisation and project performance contribute to financial results.
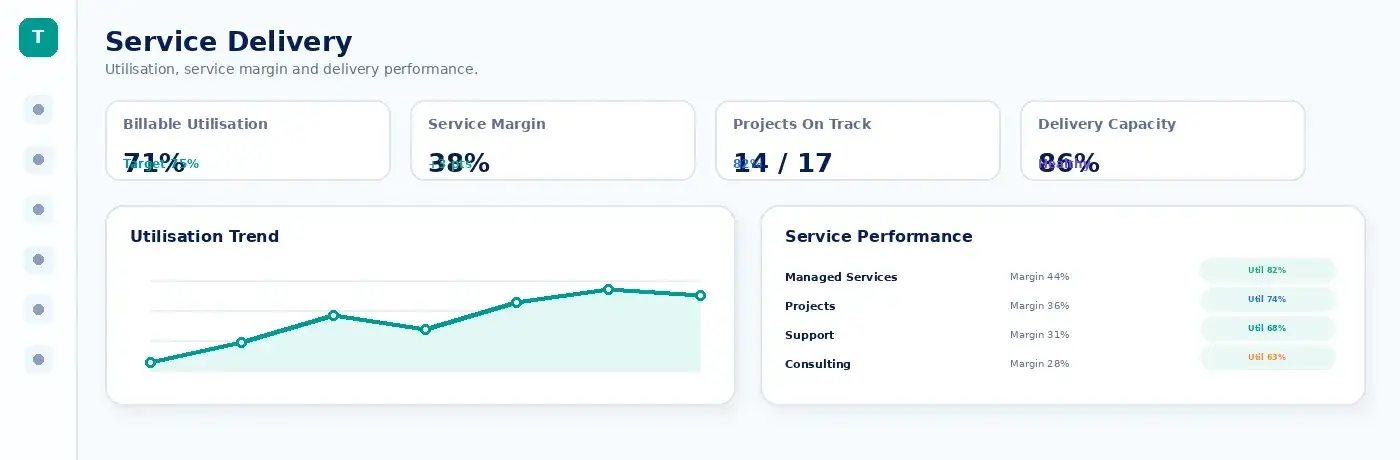
Service Delivery dashboard preview
Review service and project revenue performance
Track utilisation and labour efficiency
Understand project and delivery margin

Get the Most from This Hub

See how the calculator, dashboards, ratios and service-delivery insights work together.

Input Calculator

Configure the organisation, select the fiscal quarter and complete the required financial inputs.

Input Calculator walkthrough

What you'll do

  • Review and edit organisation settings
  • Choose whether inputs are stored locally or remotely
  • Select the active fiscal quarter
  • Choose one revenue input method
  • Complete Revenue, COGS, Expenses and Summary

What good looks like

  • Local storage keeps inputs on the current browser
  • Remote storage supports organisation access across devices
  • Only one revenue input method should be active
  • Percentage-based ratios are used for benchmarking
  • Completed inputs can unlock up to 49 metrics
0/49
Metrics unlock progressively

The available metric count increases as the required revenue, cost, expense and summary fields are completed.

Executive Summary

Review headline results and identify the metrics needing attention.

Executive Summary walkthrough

What you'll do

  • Headline revenue, profitability and productivity results
  • Financial-health and operational-performance indicators
  • Current results against available benchmark ranges
  • Metrics performing above or below expectation
  • Recommended areas for deeper investigation

What good looks like

  • Start with metrics marked as requiring attention
  • Check the underlying section before taking action
  • Compare the active quarter with earlier quarters
  • Look for connected issues rather than isolated numbers
  • Use the summary to guide the leadership discussion
TOP
Use the summary to prioritise

The Executive Summary is the starting point. Use the detailed sections to understand why a metric is strong, weak or changing.

Revenue & GM

Analyse revenue mix, cost of goods sold and gross margin.

Revenue & GM walkthrough

What you'll do

  • Total revenue for the selected fiscal quarter
  • Recurring, product, project and service revenue mix
  • Cost of goods sold by relevant category
  • Gross profit and gross-margin percentage
  • Revenue and margin movement across quarters

What good looks like

  • Is recurring revenue increasing?
  • Which revenue streams provide the strongest margin?
  • Are direct delivery costs increasing faster than revenue?
  • Are low-margin services affecting overall performance?
  • Does the revenue mix support the business strategy?
GM
Look beyond total revenue

Revenue growth is most valuable when gross margin and the quality of the revenue mix are also improving.

Opex & Productivity

Understand operating costs and productivity.

Opex & Productivity walkthrough

What you'll do

  • Operating expenditure by major category
  • Employee and contractor cost ratios
  • Revenue and gross profit per headcount
  • Operating profit and operating-margin performance
  • Changes in cost efficiency between quarters

What good looks like

  • Are operating costs growing faster than revenue?
  • Is headcount growth creating additional capacity or output?
  • Which expense categories are outside the expected range?
  • Is productivity improving as the organisation scales?
  • Can recurring costs be reduced without affecting delivery?
OPEX
Connect cost with output

A cost should be evaluated alongside the capability, revenue or customer outcome it supports.

Operational Ratios

Review liquidity, efficiency and working-capital ratios.

Operational Ratios walkthrough

What you'll do

  • Liquidity and short-term financial-resilience ratios
  • Debtor days and speed of customer collections
  • Creditor days and supplier-payment patterns
  • Working-capital and cash-conversion efficiency
  • Operational ratios compared with benchmarks

What good looks like

  • Can the business meet short-term obligations?
  • Are customer payments being collected quickly enough?
  • Is working capital supporting or restricting growth?
  • Are supplier-payment practices sustainable?
  • Which ratio requires an immediate management response?
RATIO
Review ratios together

A single ratio rarely tells the complete story. Review liquidity, profitability, productivity and working capital as one connected picture.

Service Delivery

Connect delivery performance with revenue and margin.

Service Delivery walkthrough

What you'll do

  • Service revenue and delivery-related income
  • Billable utilisation and productive capacity
  • Labour efficiency and delivery cost
  • Project, managed-service and support margin
  • Delivery indicators affecting customer and financial outcomes

What good looks like

  • Is available delivery capacity being used effectively?
  • Which services create the strongest contribution margin?
  • Are projects being delivered within expected cost?
  • Is non-billable activity affecting productivity?
  • Do service-delivery results support profitable growth?
SD
Link delivery to financial outcomes

Service Delivery explains how operational performance influences revenue quality, gross margin and workforce productivity.

Next: Executive Summary

Common Questions

Are exact financial figures used for benchmarking?

Benchmarking uses calculated percentage-based ratios. Users can choose local-only storage or remote storage for their raw inputs.

What is the difference between local and remote storage?

Local storage keeps the inputs on the current browser and device. Remote storage allows authorised organisation users to access and edit the information from another device.

Can I enter revenue in more than one way?

The calculator provides alternative revenue input methods, but only one method should be selected for the active fiscal quarter.

Why are some metrics unavailable?

Metrics are unlocked when the required revenue, cost, expense and summary inputs have been completed.

What should I review first?

Begin with the Executive Summary, then investigate any detailed metric marked as requiring attention.